Nature of Work › Disciplinary Analysis
* For help understanding this visualization, see "Guide" tab.
* To see the full name of column header, hover pointer over short name in external comparison column header.
* To see the full name of column header, hover pointer over short name in external comparison column header.
|
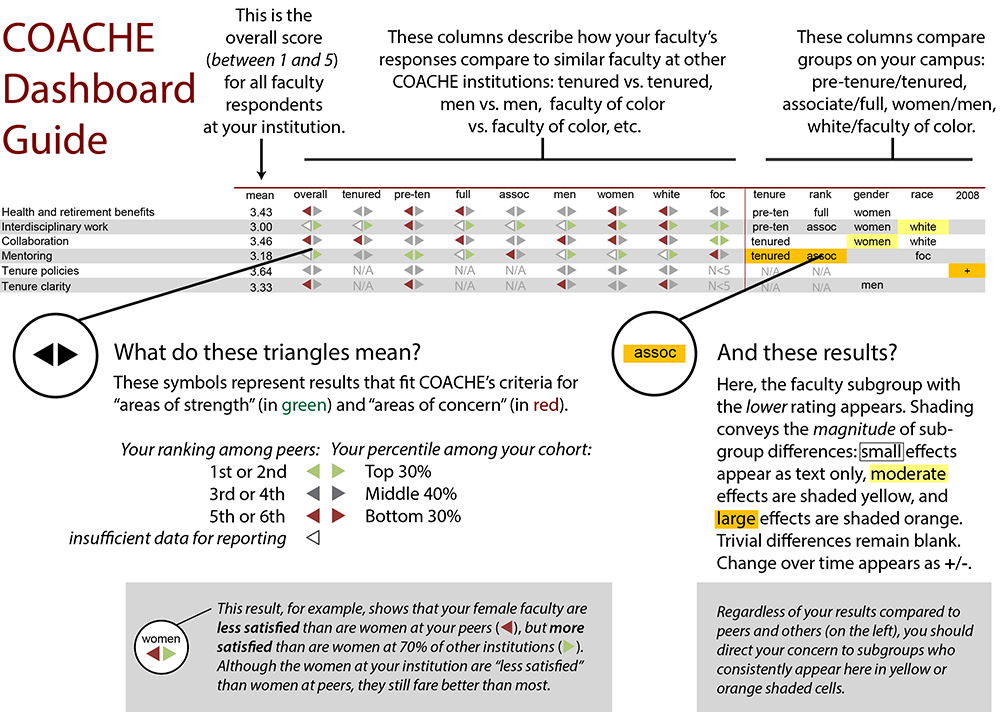
Your results compared to PEERS ◄
Your results compared to COHORT ► |
Areas of strength in GREEN
Areas of concern in RED |
Within campus differences
sm (.1)med. (.3)lrg. (.5) |
|||||||||||||||||||||||||
mean |
overall |
Hum |
Soc |
Phy |
Bio |
VPA |
ECM |
HHE |
Agr |
Bus |
Edu |
Med |
Oth |
Hum vs other |
Soc vs other |
Phy vs other |
Bio vs other |
VPA vs other |
ECM vs other |
HHE vs other |
Agr vs other |
Bus vs other |
Edu vs other |
Med vs other |
Oth vs other |
2015 |
|
Nature of Work: Research |
3.65
|


|


|
|
|

|

|
N<5
|
N<5
|
N<5
|
N<5
|
N<5
|
N<5
|
N<5
|
Hum
|
Soc
|
other
|
other
|
other
|
N<5
|
N<5
|
N<5
|
N<5
|
N<5
|
N<5
|
N<5
|
-
|
Time spent on research |
2.95
|
|

|
|
|
|
|
N<5
|
N<5
|
N<5
|
N<5
|
N<5
|
N<5
|
N<5
|
Hum
|
other
|
Phy
|
Bio
|
other
|
N<5
|
N<5
|
N<5
|
N<5
|
N<5
|
N<5
|
N<5
|
-
|
Expectations for finding external funding |
3.71
|
|
|
|
|
|
N<5
|
N<5
|
N<5
|
N<5
|
N<5
|
N<5
|
N<5
|
N<5
|
Hum
|
|
other
|
|
N<5
|
N<5
|
N<5
|
N<5
|
N<5
|
N<5
|
N<5
|
N<5
|
-
|
Influence over focus of research |
4.59
|
|
|
|
|
|
|
N<5
|
N<5
|
N<5
|
N<5
|
N<5
|
N<5
|
N<5
|
Hum
|
|
other
|
other
|
other
|
N<5
|
N<5
|
N<5
|
N<5
|
N<5
|
N<5
|
N<5
|
-
|
Quality of grad students to support research |
N/A
|
N/A
|
N/A
|
N/A
|
N/A
|
N/A
|
N/A
|
N/A
|
N/A
|
N/A
|
N/A
|
N/A
|
N/A
|
N/A
|
N/A
|
N/A
|
N/A
|
N/A
|
N/A
|
N/A
|
N/A
|
N/A
|
N/A
|
N/A
|
N/A
|
N/A
|
N/A
|
Support for research |
3.94
|
|
|
|
|
|
|
N<5
|
N<5
|
N<5
|
N<5
|
N<5
|
N<5
|
N<5
|
|
Soc
|
other
|
|
|
N<5
|
N<5
|
N<5
|
N<5
|
N<5
|
N<5
|
N<5
|
-
|
Support for engaging undergrads in research |
4.04
|
|
|
|
|
|
|
N<5
|
N<5
|
N<5
|
N<5
|
N<5
|
N<5
|
N<5
|
Hum
|
|
other
|
other
|
other
|
N<5
|
N<5
|
N<5
|
N<5
|
N<5
|
N<5
|
N<5
|
|
Support for obtaining grants (pre-award) |
3.19
|
|
|
|
|
|
|
N<5
|
N<5
|
N<5
|
N<5
|
N<5
|
N<5
|
N<5
|
|
|
Phy
|
other
|
other
|
N<5
|
N<5
|
N<5
|
N<5
|
N<5
|
N<5
|
N<5
|
-
|
Support for maintaining grants (post-award) |
3.54
|
|
|
|
|
N<5
|
N<5
|
N<5
|
N<5
|
N<5
|
N<5
|
N<5
|
N<5
|
N<5
|
Hum
|
other
|
Phy
|
N<5
|
N<5
|
N<5
|
N<5
|
N<5
|
N<5
|
N<5
|
N<5
|
N<5
|
+
|
Support for securing grad student assistance |
N/A
|
N/A
|
N/A
|
N/A
|
N/A
|
N/A
|
N/A
|
N/A
|
N/A
|
N/A
|
N/A
|
N/A
|
N/A
|
N/A
|
N/A
|
N/A
|
N/A
|
N/A
|
N/A
|
N/A
|
N/A
|
N/A
|
N/A
|
N/A
|
N/A
|
N/A
|
N/A
|
Support for travel to present/conduct research |
4.25
|
|
|
|
|
|
|
N<5
|
N<5
|
N<5
|
N<5
|
N<5
|
N<5
|
N<5
|
|
|
|
other
|
|
N<5
|
N<5
|
N<5
|
N<5
|
N<5
|
N<5
|
N<5
|
-
|
Availability of course release for research |
2.40
|
|
|
|
|
|
|
N<5
|
N<5
|
N<5
|
N<5
|
N<5
|
N<5
|
N<5
|
Hum
|
|
Phy
|
other
|
other
|
N<5
|
N<5
|
N<5
|
N<5
|
N<5
|
N<5
|
N<5
|
-
|
Nature of Work: Service |
3.25
|
|
|
|
|
|
|
N<5
|
N<5
|
N<5
|
N<5
|
N<5
|
N<5
|
N<5
|
|
|
other
|
other
|
VPA
|
N<5
|
N<5
|
N<5
|
N<5
|
N<5
|
N<5
|
N<5
|
-
|
Time spent on service |
3.14
|
|
|
|
|
|
|
N<5
|
N<5
|
N<5
|
N<5
|
N<5
|
N<5
|
N<5
|
|
|
Phy
|
other
|
|
N<5
|
N<5
|
N<5
|
N<5
|
N<5
|
N<5
|
N<5
|
-
|
Support for faculty in leadership roles |
2.89
|
|
|
|
|
|
|
N<5
|
N<5
|
N<5
|
N<5
|
N<5
|
N<5
|
N<5
|
Hum
|
|
other
|
|
|
N<5
|
N<5
|
N<5
|
N<5
|
N<5
|
N<5
|
N<5
|
-
|
Number of committees |
3.42
|
|
|
|
|
|
|
N<5
|
N<5
|
N<5
|
N<5
|
N<5
|
N<5
|
N<5
|
Hum
|
other
|
other
|
other
|
VPA
|
N<5
|
N<5
|
N<5
|
N<5
|
N<5
|
N<5
|
N<5
|
-
|
Attractiveness of committees |
3.60
|
|
|
|
|
|
|
N<5
|
N<5
|
N<5
|
N<5
|
N<5
|
N<5
|
N<5
|
Hum
|
other
|
other
|
other
|
|
N<5
|
N<5
|
N<5
|
N<5
|
N<5
|
N<5
|
N<5
|
|
Discretion to choose committees |
3.57
|
|
|
|
|
|
|
N<5
|
N<5
|
N<5
|
N<5
|
N<5
|
N<5
|
N<5
|
Hum
|
Soc
|
other
|
other
|
other
|
N<5
|
N<5
|
N<5
|
N<5
|
N<5
|
N<5
|
N<5
|
-
|
Equitability of committee assignments |
2.78
|
|
|
|
|
|
|
N<5
|
N<5
|
N<5
|
N<5
|
N<5
|
N<5
|
N<5
|
other
|
|
|
|
VPA
|
N<5
|
N<5
|
N<5
|
N<5
|
N<5
|
N<5
|
N<5
|
-
|
Number of student advisees |
3.58
|
|
|
|
|
|
|
N<5
|
N<5
|
N<5
|
N<5
|
N<5
|
N<5
|
N<5
|
other
|
Soc
|
Phy
|
|
other
|
N<5
|
N<5
|
N<5
|
N<5
|
N<5
|
N<5
|
N<5
|
|
Support for being a good advisor |
3.33
|
|
|
|
|
|
|
N<5
|
N<5
|
N<5
|
N<5
|
N<5
|
N<5
|
N<5
|
|
|
|
other
|
|
N<5
|
N<5
|
N<5
|
N<5
|
N<5
|
N<5
|
N<5
|
N/A
|
Equity of the distribution of advising responsibilities |
3.59
|
|
|
|
|
|
|
N<5
|
N<5
|
N<5
|
N<5
|
N<5
|
N<5
|
N<5
|
|
Soc
|
other
|
other
|
|
N<5
|
N<5
|
N<5
|
N<5
|
N<5
|
N<5
|
N<5
|
N/A
|
Nature of Work: Teaching |
4.02
|
|
|
|
|
|
|
N<5
|
N<5
|
N<5
|
N<5
|
N<5
|
N<5
|
N<5
|
other
|
Soc
|
|
|
other
|
N<5
|
N<5
|
N<5
|
N<5
|
N<5
|
N<5
|
N<5
|
-
|
Time spent on teaching |
3.93
|
|
|
|
|
|
|
N<5
|
N<5
|
N<5
|
N<5
|
N<5
|
N<5
|
N<5
|
other
|
Soc
|
Phy
|
Bio
|
other
|
N<5
|
N<5
|
N<5
|
N<5
|
N<5
|
N<5
|
N<5
|
-
|
Number of courses taught |
3.35
|
|
|
|
|
|
|
N<5
|
N<5
|
N<5
|
N<5
|
N<5
|
N<5
|
N<5
|
|
Soc
|
other
|
other
|
other
|
N<5
|
N<5
|
N<5
|
N<5
|
N<5
|
N<5
|
N<5
|
-
|
Level of courses taught |
4.26
|
|
|
|
|
|
|
N<5
|
N<5
|
N<5
|
N<5
|
N<5
|
N<5
|
N<5
|
Hum
|
other
|
other
|
Bio
|
other
|
N<5
|
N<5
|
N<5
|
N<5
|
N<5
|
N<5
|
N<5
|
|
Discretion over course content |
4.65
|
|
|
|
|
|
|
N<5
|
N<5
|
N<5
|
N<5
|
N<5
|
N<5
|
N<5
|
other
|
other
|
|
Bio
|
other
|
N<5
|
N<5
|
N<5
|
N<5
|
N<5
|
N<5
|
N<5
|
|
Number of students in classes taught |
3.94
|
|
|
|
|
|
|
N<5
|
N<5
|
N<5
|
N<5
|
N<5
|
N<5
|
N<5
|
other
|
Soc
|
Phy
|
|
other
|
N<5
|
N<5
|
N<5
|
N<5
|
N<5
|
N<5
|
N<5
|
|
Quality of students taught |
4.52
|
|
|
|
|
|
|
N<5
|
N<5
|
N<5
|
N<5
|
N<5
|
N<5
|
N<5
|
other
|
Soc
|
Phy
|
other
|
VPA
|
N<5
|
N<5
|
N<5
|
N<5
|
N<5
|
N<5
|
N<5
|
+
|
Equitability of distribution of teaching load |
3.73
|
|
|
|
|
|
|
N<5
|
N<5
|
N<5
|
N<5
|
N<5
|
N<5
|
N<5
|
|
Soc
|
|
other
|
other
|
N<5
|
N<5
|
N<5
|
N<5
|
N<5
|
N<5
|
N<5
|
|
Quality of grad students to support teaching |
N/A
|
N/A
|
N/A
|
N/A
|
N/A
|
N/A
|
N/A
|
N/A
|
N/A
|
N/A
|
N/A
|
N/A
|
N/A
|
N/A
|
N/A
|
N/A
|
N/A
|
N/A
|
N/A
|
N/A
|
N/A
|
N/A
|
N/A
|
N/A
|
N/A
|
N/A
|
N/A
|
Teaching schedule |
4.21
|
|
|
|
|
|
|
N<5
|
N<5
|
N<5
|
N<5
|
N<5
|
N<5
|
N<5
|
other
|
Soc
|
Phy
|
|
other
|
N<5
|
N<5
|
N<5
|
N<5
|
N<5
|
N<5
|
N<5
|
N/A
|
Support for teaching diverse learning styles |
3.67
|
|
|
|
|
|
|
N<5
|
N<5
|
N<5
|
N<5
|
N<5
|
N<5
|
N<5
|
|
other
|
Phy
|
Bio
|
other
|
N<5
|
N<5
|
N<5
|
N<5
|
N<5
|
N<5
|
N<5
|
N/A
|
Support for assessing student learning |
3.90
|
|
|
|
|
|
|
N<5
|
N<5
|
N<5
|
N<5
|
N<5
|
N<5
|
N<5
|
other
|
other
|
Phy
|
other
|
|
N<5
|
N<5
|
N<5
|
N<5
|
N<5
|
N<5
|
N<5
|
N/A
|
Support for developing online/hybrid courses |
3.46
|
|
|
|

|
N<5
|
N<5
|
N<5
|
N<5
|
N<5
|
N<5
|
N<5
|
N<5
|
N<5
|
other
|
Soc
|
Phy
|
N<5
|
N<5
|
N<5
|
N<5
|
N<5
|
N<5
|
N<5
|
N<5
|
N<5
|
N/A
|
Support for teaching online/hybrid courses |
3.41
|
|
|
|
|
N<5
|
N<5
|
N<5
|
N<5
|
N<5
|
N<5
|
N<5
|
N<5
|
N<5
|
other
|
Soc
|
Phy
|
N<5
|
N<5
|
N<5
|
N<5
|
N<5
|
N<5
|
N<5
|
N<5
|
N<5
|
N/A
|
Related Survey Items |
--
|
--
|
--
|
--
|
--
|
--
|
--
|
--
|
--
|
--
|
--
|
--
|
--
|
--
|
--
|
--
|
--
|
--
|
--
|
--
|
--
|
--
|
--
|
--
|
--
|
--
|
--
|
Time spent on outreach |
3.43
|
|
|
|
|
|
N<5
|
N<5
|
N<5
|
N<5
|
N<5
|
N<5
|
N<5
|
N<5
|
|
Soc
|
other
|
other
|
N<5
|
N<5
|
N<5
|
N<5
|
N<5
|
N<5
|
N<5
|
N<5
|
-
|
Time spent on administrative tasks |
2.82
|
|
|
|
|
|
|
N<5
|
N<5
|
N<5
|
N<5
|
N<5
|
N<5
|
N<5
|
|
other
|
|
Bio
|
VPA
|
N<5
|
N<5
|
N<5
|
N<5
|
N<5
|
N<5
|
N<5
|
|
Ability to balance teaching/research/service |
2.87
|
|
|
|
|
|
|
N<5
|
N<5
|
N<5
|
N<5
|
N<5
|
N<5
|
N<5
|
|
other
|
Phy
|
Bio
|
other
|
N<5
|
N<5
|
N<5
|
N<5
|
N<5
|
N<5
|
N<5
|
-
|