Blog
Launched January 2021 - President Wippman, members of senior staff, and campus leaders share insights, information, and inspiration
Enhancements to the COVID-19 Dashboard
By Joe Shelley, Vice President for Libraries and Information Technology
January 20, 2021
Hamilton’s pandemic readiness and response has required a lot of important behind-the-scenes work. One of the efforts has been the development and maintenance of our campus COVID-19 dashboard, led by Mike Sprague, Director of Business Intelligence and Web Services, in collaboration with multiple College departments. I am grateful for all their hard work and for the input they gathered between semesters to make the dashboard even better for the next semester.
Here are a few of the enhancements:
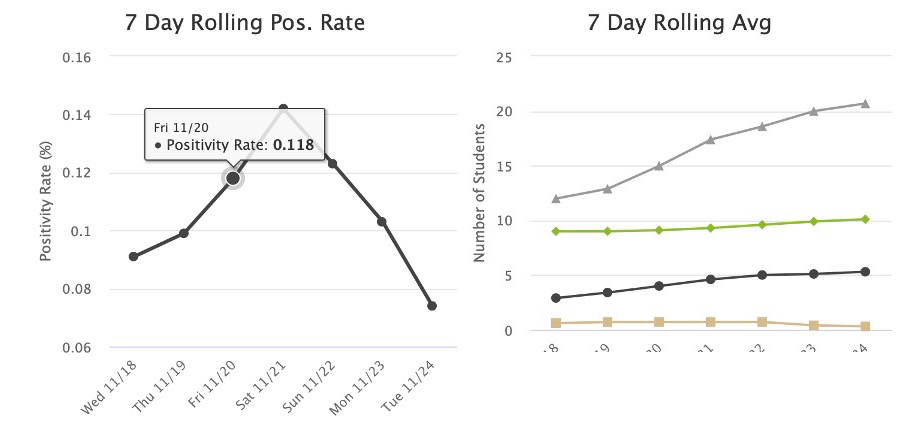
Seven-day rolling averages
Since the day-to-day reporting of new cases, active cases, resolved cases, and quarantine are so variable, we added new graphs to show seven-day rolling averages. These rolling averages help visualize trends more clearly.
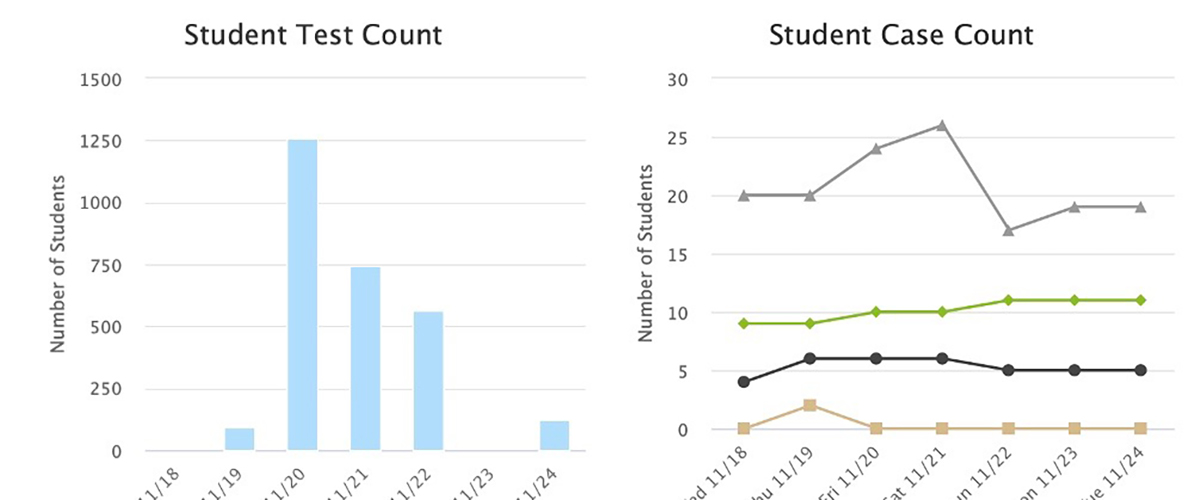
Fixing the scale
Hamilton has implemented an impressive COVID-19 testing program. We test so frequently that the scale of our testing diminished the relatively small number of positive cases last fall. This caused a problem in our graphs. When the scale of a graph goes up to 1,500 COVID tests, a line representing fewer than 10 positive cases just looks flat. We resolved this by creating separate visualizations for the test results.
Third-party tests
Sometimes, employees get tested off-campus. If an employee tests positive and was recently on campus, then the COVID-19 Task Force notifies the campus community. However, showing these results on the dashboard is tricky to do without skewing the statistics for our on-campus testing program. To address this, we created another field in the employee section to report these third-party test results for employees.
Also, we have added the average time it takes to receive test results, how many times our community members are tested per week, and visualizations for regional statistics.
The new version of the dashboard is scheduled to go live when students return to the Hill next week and we begin reporting on-campus testing data. We hope these improvements will provide our community with more information and insights as we head into a new semester.
Contact
Office of the President
