Calibration & Validation
Calibration
Proper calibration of XRF instruments for diverse earth science samples requires correct subtraction of background and spectral interferences for a variety of matrices (igneous rocks, soils, peridotites, limestones, Fe-formations, etc).
Background subtraction formulas for our machine are typically linear functions of intensity measured on a single background (which reduces the number of spectral interferences); a few elements have more complex quadratic fits or utilize the intensity of the Compton scatter peak. Correction for spectral interferences is vital in determining accurate concentrations, to wit: other analytes may emit lines that overlap the analyte element line of interest within the resolution of the spectrometer, or Compton scatter from an intense line may tail onto the peak or background of another analyte. It is impossible to correct all spectral interferences accurately for all potential rock matrices given the current industry software. Useful approximations can be determined for each spectrometer but these require extensive experimentation with spec-pure compounds. Since all elements either absorb or enhance any X-ray energy to some extent, correction for absorbance and enhancement is also vitally important. We have chosen to employ a LOI-eliminated set of coefficients for this calculation because it reduces the small errors involved in sample preparation and instrument response and renders correction for such errors linear. Proper calibration reduces measurement uncertainty to its lowest possible value.
For the calibration of the Hamilton Analytical Lab (HAL) instrument a diverse set of more than 70 reference materials is used, including, among others, several of those issued by the USGS, the British Chemical Society (BCS), the Geological Survey of Japan (GSJ), and the National Institute of Standards and Technology (NIST). Considerable effort was spent upgrading their certificate values, many of which are outdated. The dataset employed came largely from the GeoReM website, using analytical judgement and experience to evaluate and select the best data. The GeoREM site compiles analytical data on geologic reference materials (RMs) that have been reported in the literature during the past few decades (chiefly post Govindaraju, 1994; 1994 compilation of working values and sample description for 383 geostandards: Geostandards Newsletter, v. 18, Special Issue, p. 1-158). Because modern analytical methods are typically more precise and accurate than those employed to certify most RMs in the past, a database of modern analyses is necessary and useful.
HAL values are as consistent as possible with the values proposed by Jochum et al. (2015; Reference values following ISO guidelines for frequently requested rock reference materials: Geostandards and Geoanalytical Research, v. 40, p. 333-350) and the HAL calibration uses their revised values for the 16 mainly USGS and Geological Survey of Japan reference materials for which they compiled and assessed data. Some Zr values are based upon our own compilation and assessment of literature values. In general, both Zr and Nb data suffer because the elements are mono-isotopic and concentrated in acid-resistant minerals. The problem is compounded by the use of small, unrepresentative, or incompletely digested, aliquots in ICP-MS determinations.
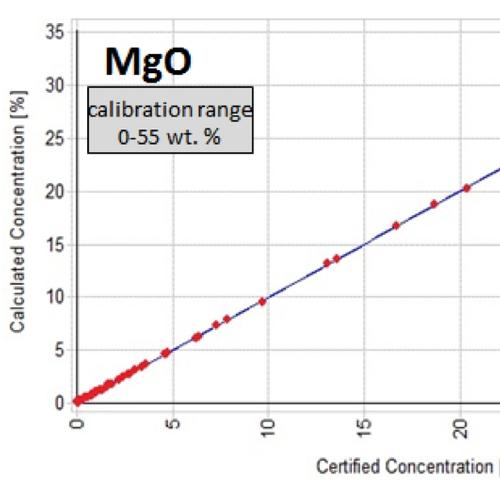
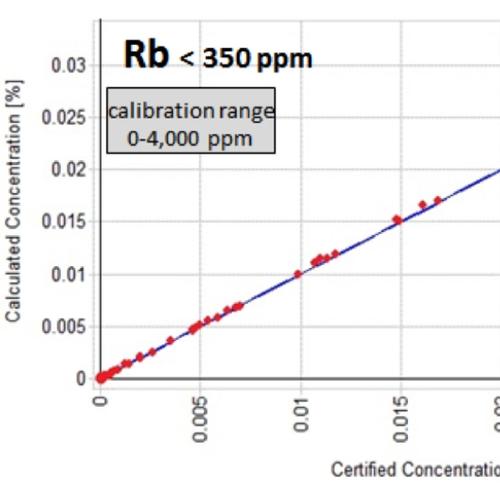
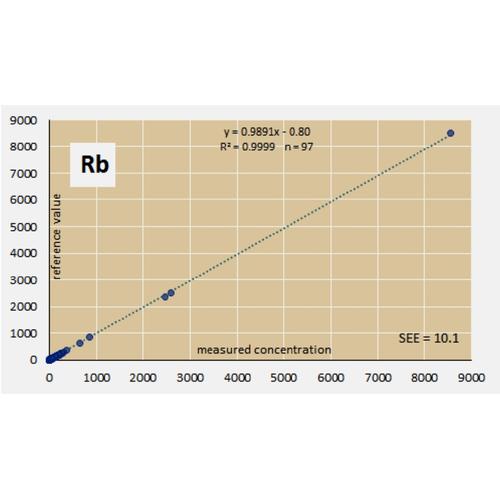
Calibrations for each of the 44 elements determined may be found by clicking on the element in the list below. Calibration curves are shown below for MgO and Rb as examples. As noted in Preparation Methods, powdered samples with high MgO concentrations, such as peridotites or dolomites, are diluted with high-purity silica prior to fusion. That allows a crystallite-free glass to congeal upon cooling using the low dilution recipe. The data are displayed as analyzed, not corrected for the silica addition. The same technique is used for P-, Ca-, Mn-, and Fe-rich reference materials and samples. The addition does degrade the precision in some cases (see Measurement Uncertainty) but still yields data fit for many purposes.
Key to charts, in order of presentation:
- Calibration charts – first chart
- Raw validation charts – buff background
- Normalized validation charts for major elements – light blue background
- Precision tests – green background (raw data blue, normalized data orange; raw quartz-diluted data light blue, normalized purple)
- Average validation uncertainty – dark blue background (raw data blue, normalized data dark orange; raw quartz-diluted data light blue, normalized light orange)
- Reference material uncertainty – final chart
Validation
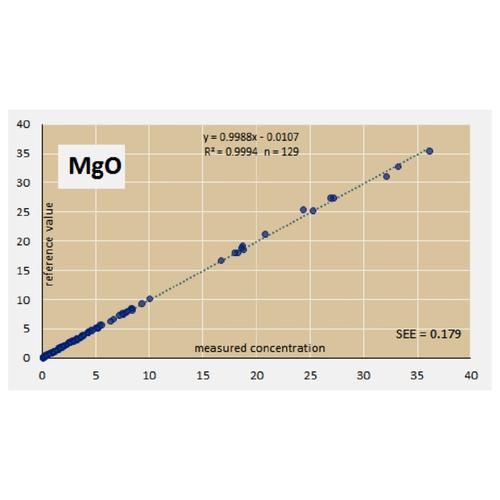
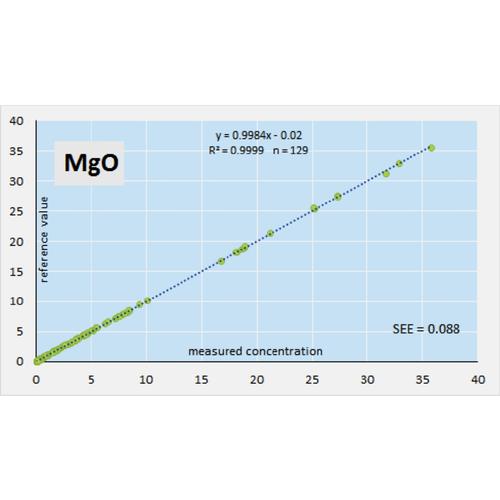
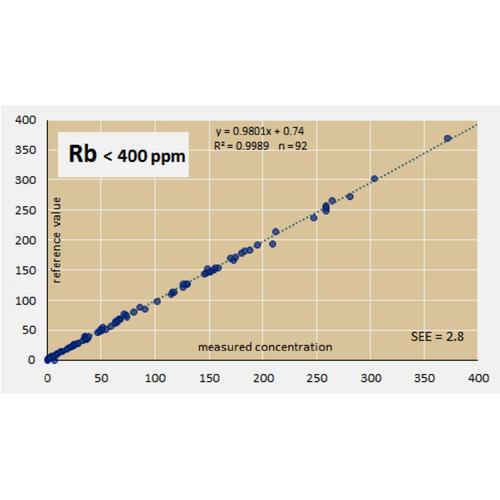
Every analytical method requires validation of the calibration to demonstrate its efficacy with unknowns of diverse composition. Validation tests at HAL include analyses of many more RMs as unknowns than employed in calibration; none of the validation RMs tested were used in the calibration. The validation curves for MgO and Rb are shown below as examples. The validation results for each element can be found by clicking on that element in the list above.
Comparison of normalized data typically results in a large reduction of uncertainties for major elements. In XRF analysis, the normalization is often done by summing the major and minor elements to an arbitrary value, often 100%, or 99.6 wt % to accommodate the expected small contribution from the trace elements. Because we used RMs for the validation tests, for normalized values we simply normalized the raw data so that the sum of the major and minor elements equaled the sum of the same elements in the RMs. This results in smaller uncertainties for the major elements. Normalization affects the more concentrated elements most because all of the variation in the raw analysis (due to small changes in instrument state and response, small differences in pellet to tube distance, spectrometer vacuum, surface polish, and weigh errors, etc.) is compressed into the constrained sum. For that reason, most spectrographic analytical methods employ normalization to allow more precise comparisons of data.
The best XRF data is not necessarily that with the best sum (ideally 100 wt %, including LOI and volatiles lost during fusion). Instead, the best data is determined with the most accurate background and spectral interference corrections. A robust absorbance and enhancement algorithm allows the errors noted above to be accommodated flexibly so that determinations are less sensitive to small variations in raw intensities.
Results of GeoProficiency (GEOPT) Tests
HAL is a participant in the GeoProficiency test program, which evaluates the performance of approximately 100 earth science analytical labs around the world.
Reproducibility of Reference Materials (RM) Analyses
HAL has prepared glass beads for most RMs. We will run a particular RM with your batch of samples at your request. Average results for RMs that we run often, namely AGV-1, BHVO-1, G-1, GSP-1, JR-2, and SCo-1.
Contact
Contact Name
Hamilton Analytical Laboratory
