Measurement Uncertainty
Every measurement contains uncertainty. It isn’t possible to measure a “true” value using any analytical method in existence. Therefore, assessment of uncertainty is vital because it can strongly affect interpretation of data and decisions regarding suitability of the method for the data to be gathered. In other words, is the data “fit for purpose”? Uncertainty assessment may also play a large role in the case of regulatory decisions. The total uncertainty of any measurement system is difficult to fully evaluate, and two approaches are currently advised.
In one, the so-called “GUM” approach (Guide to the Expression of Uncertainty in Measurement: 1st Ed. 1993), the uncertainty of each and every step of the method employed is tested and evaluated. This is a very tedious way to assess total uncertainty so an alternative approach is more often employed, the so-called “Nordtest“ method (Nordtest TR 537: Handbook for Calculation of Measurement Uncertainty in Environmental Laboratories, 2004), proposed by the Nordic Council of Ministers. The Nordtest method relies upon an uncertainty assessment of the overall method of measurement, rather than an evaluation of each and every step of the method. We adapted the Nordtest method for our assessment of uncertainty across the range of concentrations commonly encountered in geologic samples.
In the Nordtest method, four components contribute uncertainty to the measurement of concentrations in XRF analysis of rocks:
- Measurement precision (precision % rsd or relative standard deviation)
- Uncertainty in the determination of Reference Material (RM) values (validation % difference)
- Uncertainty in RM values (RMu)
- Uncertainty due to instrumental drift
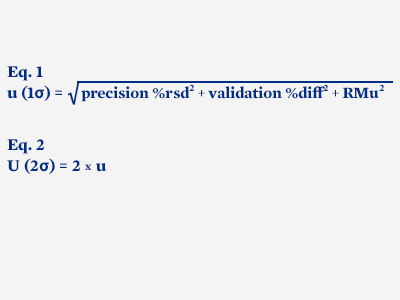 Summation of the four contributions to uncertainty in the Nordtest method is done by taking the square root of the sum of the squared one sigma uncertainties (Equation 1, expressed as % rsd). Drift uncertainty is not included in the calculation because HAL drift is essentially zero. The summed uncertainty (u) is then multiplied by two to calculate the total uncertainty (U) at 95 % confidence (Equation 2, 2 sigma).
The Nordtest calculation, however, is only designed to express average uncertainty, irrespective of concentration. A slight modification of the method allows calculation of the total uncertainty across a range of concentration. First, for each element, the 1 sigma uncertainty is calculated for each of the three power functions fit to the three uncertainty components at several concentrations (appropriate to the range of concentration in each case). Those values are squared and then summed. Then, for each element, a power function is fit to two times the square root of the calculated sums of squares. This results in a function that is the average total uncertainty for any concentration of the element.
- Download a spreadsheet with total uncertainty calculations for every HAL analyte
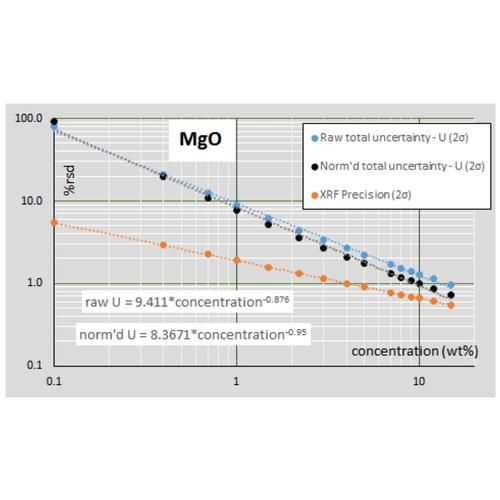
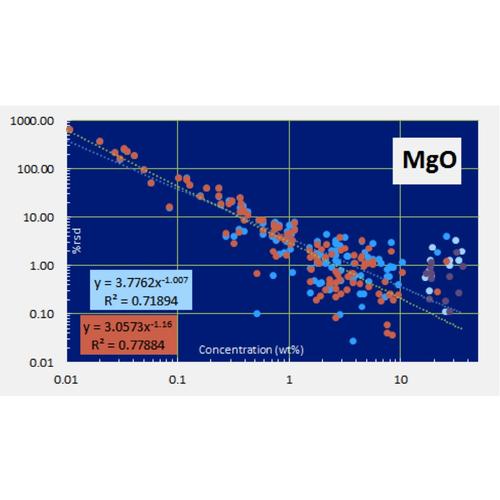
For major elements the calculation is performed for both raw and normalized data, an example is shown below for MgO. This figure also illustrates that the XRF precision is far better than the total uncertainty for MgO. The contributions to the total uncertainty in MgO from the RM and validation uncertainties greatly exceed that of the XRF precision.
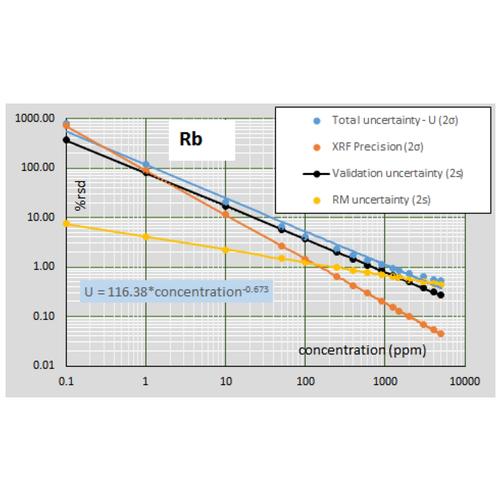
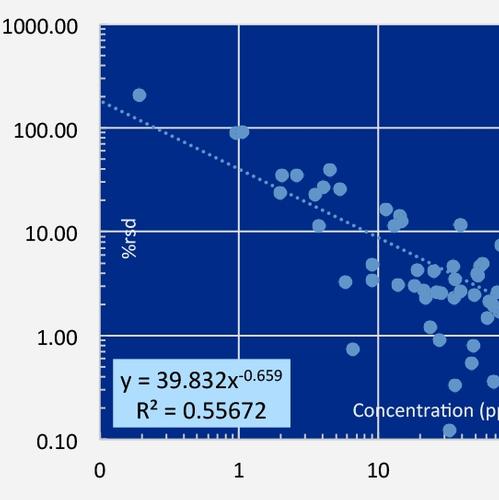
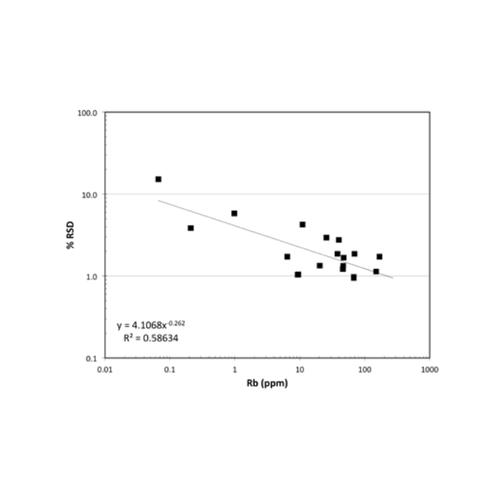
The uncertainty budget of trace elements differs from that of major elements (as shown below for Rb). Because other analytical techniques, for example ICP-MS and graphite furnace AA, are much more sensitive than XRF to ultra-trace quantities, the RM uncertainties are very low compared with XRF below about 50 ppm. For XRF data, the uncertainty budget at all trace element concentrations is dominated by the validation uncertainty, which greatly exceeds the XRF precision at higher concentrations. ICP-MS trace element data, with its near constant 2-5% rsd, is often treated as superior to XRF data, but this is not so for trace concentrations above a few hundred ppm.
Measurement precision
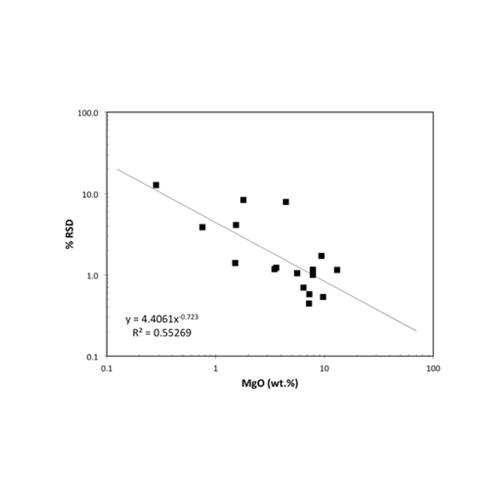
Determination of measurement precision of a XRF instrument for each analyte is a challenging task for geologic samples due to the diversity of rock types and the large range of concentrations encountered. To address the precision of the HAL analytical routine, including most of the preparation stage, 11 replicate glass pellets for each of 16 diverse lithologies were prepared from powder, including two peridotites, one limestone, one sandstone, one artificial alumina-rich material, one carbonatite, one artificial volatile-enriched material, one Mn-nodule, and several common volcanic and plutonic rocks ranging from basalt to obsidian, diorite to syenite and granite. The pellets were measured as unknowns using the normal (29 mm dia.) calibration. The percent relative standard deviations of each of the 16 unknowns were fit versus their measured concentrations with power functions in log-log plots (Horwitz et al., 1980, J Assoc Off Anal Chem, 1980, 63, 1344; Thompson, 2004, The amazing Horwitz function: AMC Technical Brief No.17, Royal Society of Chemistry). Examples of the results for MgO and Rb are shown below. For the results of these experiments for any HAL analyte, click on the element of interest in the list on the Calibration and Uncertainty page.
Uncertainty in Determination of Reference Material (RM) Values
The second Nordtest uncertainty component is the uncertainty in measurement of reference materials as unknowns. These uncertainties are derived from validation tests of a diverse set of RMs and thus should mimic the measurement uncertainty in analysis of unknown samples. It is necessary to use RMs for evaluation of these uncertainties because of the need for comparison to “true” concentrations. This uncertainty thus represents how accurately a method can reproduce the known values of diverse samples. In classic terms this is the instrument “bias”. The validation data were fit with power functions in log-log plots to determine the average uncertainty across the range of concentration for each element. MgO and Rb are again shown as examples. Real data such as this can have wide ranges of uncertainty at a given concentration; again, such a fit predicts the average uncertainty. For the results of these validation tests for any HAL analyte, click on the element of interest in the list on the Calibration and Uncertainty page.
Uncertainty in Reference Material (RM) Values
The third Nordtest component of measurement uncertainty is the uncertainty in the reference materials employed. This uncertainty is difficult to fully assess due to the poor reporting of uncertainty for some RMs. In addition, the large number of RMs employed at HAL for analysis would require an extensive compilation for the number of elements determined. To minimize this uncertainty for most elements, and for the most efficient calculations, we use the recent report of Jochum et al. (2015, noted above). The report includes an estimate of total uncertainty (at 2 sigma) for each element for 16 revised RMs. Illustrations, again for MgO and Rb, are shown below. For the results of these compilations for any HAL analyte, click on the element of interest in the list on the Calibration and Uncertainty page.
Uncertainty Due to Drift
The fourth and final Nordtest uncertainty component is instrument drift. Intensities can be measured during calibration, and for precision and validation tests during a short time frame. However, the analyst must ask whether the instrument, over longer periods of time, will produce the same intensities? In other words, do slight changes in the stability or aging of the instrument components (tube, analyzing crystals, detectors, power supply, electronics, vacuum, etc) lead to slight changes in intensity over time? Most XRF analysts employ drift corrections to correct intensities back to those acquired at the calibration, or even the original set-up, stage. Drift monitors of various kinds are used. None are perfect and all are subject to a surface buildup of radiation damage over time that can affect the light elements in particular. Instruments also contain more or less volatile components such as vacuum pump oil, rubber O-rings, and nylon seals. The first can coat sample surfaces with sulfur while the latter two may add a patina of fluorine due to degassing of F-bearing materials. A systematic program of drift measurement and correction will minimize the uncertainty due to instrument drift.
A critical drift correction, especially for a new instrument, is the surface degradation of the artificial, wide d-spacing, PET analyzing crystal due to X-ray bombardment. The PET crystal is used for the determination of Al and Si intensities therefore it is vital for the accurate analysis of most geologic samples. A new instrument typically has a rapid loss of intensity from the PET crystal as it becomes damaged with use.
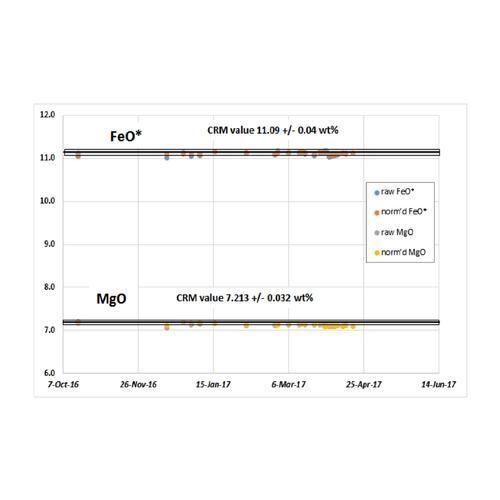
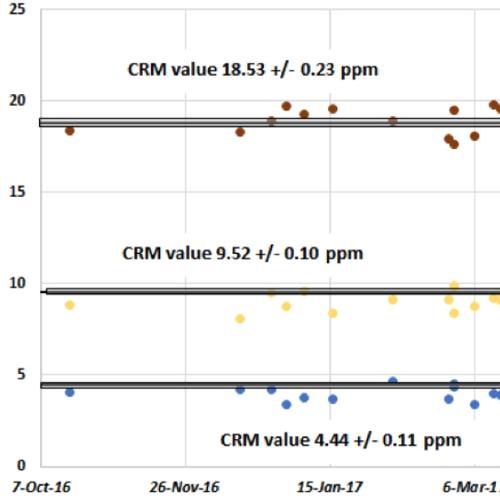
The HAL spectrometer has proven to be drift free, even for Al and Si, over a recent six-month period of operation (see chart below). The instrument is very stable even to emergency power off/power on situations. The superior performance is likely due, in part, to cabinet temperature control in the Perform’X, which keeps all of the electronic and mechanical components in a narrow temperature range. Additionally, the power supply is temperature regulated with the same cooling water that circulates continuously through the tube. Another factor that may contribute to stability in our instrument is the lower 2.5 kW tube power, compared with the 4 kW tube power common to many cabinet size XRF spectrometers. A reduced X-ray flux impacting the PET crystal may account for the lack of drift in Al and Si.
Total Uncertainty Calculation
This spreadsheet contains all of the formulas needed for calculation of the total measurement uncertainty for HAL-determined element concentrations. Received data can be pasted into the spreadsheet to perform the calculations. The results will be expressed in +/- 2 sigma or 95 % confidence and will apply to the concentration of the element in that particular sample.
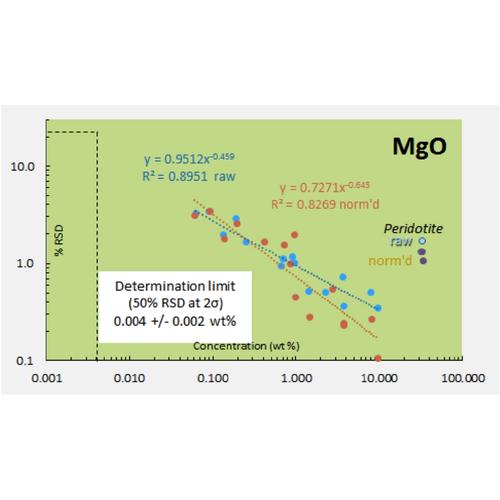
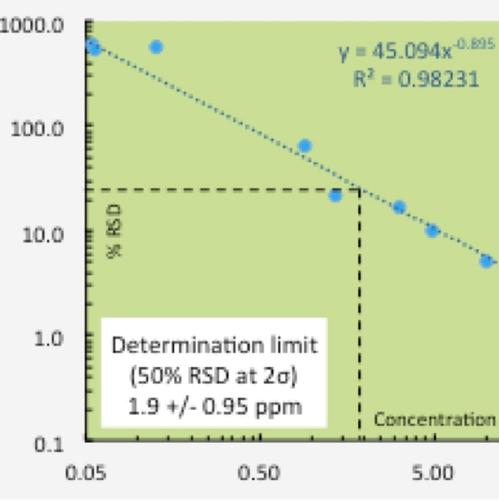
Limits of Determination
Precision tests performed across the variation in expected concentrations allow for assessment of the limit of determination (NOT “limit of detection”) for each element. The limit of determination is commonly defined as simply the concentration of an element where the determination of that concentration is 50% uncertain at 95 % confidence (2 sigma). Clearly, concentrations less than the limit of determination are very uncertain. Concentrations at half that limit are 100% uncertain and therefore represent essentially the limit of detection at 95 % confidence. We choose not to employ the term “limit of detection” because it is typically assessed at 99 % (3 sigma) confidence and so analytical conundrums ensue due to the combination of 2 sigma and 3 sigma limits. For example, one can state with 95 % confidence that a particular result is 2.0 +/- 1.0 ppm, so the result likely lies between 1.0 and 3.0 ppm. But the 3 sigma limit of detection confidence constraint may preclude reporting of that information because the analyst is not 99% confident that the element has been detected. We prefer to report data in 2 sigma terms as is common analytical practice and allow the user to evaluate the quality of the information by using the provided uncertainties.
We have chosen to use the lower instrument precision in evaluation of the limits of determination, rather than the higher total measurement uncertainty. XRF measurements, especially for major and minor elements, typically have much better precision than the uncertainties reported in RMs, which are based upon collation of data from diverse analytical methods. We rely upon the precision of our instrument, based upon the uncertainty of its measured intensities and scans of the analyte line if needed as evidence for detection at very low concentrations. Sample scans can be compared with scans of materials known to be free of the analyte to assess the influence of background noise on peak detection.
A summary of the limits of determination for the HAL standard size fused bead XRF analysis is provided.
Contact
Contact Name
Hamilton Analytical Laboratory
